


Home Articles Web design & development Using heatmaps for website analytics

The key to good website performance is rooted in understanding your visitors’ behaviour: what are they looking for? Did they find it? What do they like about your website and what puts them off? Basically – what’s hot and what’s not on your website.
In this article, we take a look at how heatmaps can help provide an overview of how visitors behave when they visit your website and how you can use this information to improve your website’s performance.
What is a heatmap?
Heatmaps use colour to visually show how visitors have moved around your web pages – where they have clicked or spent time. They are a very effective tool to show and analyse visitor behaviour on a website.
They visually track mouse movement, show where visitors click on a page, how far they scroll down the page and can even display eye-tracking tests. This information can help you see what information is of interest to your visitors and what content they may not even see. For example, if visitors don’t scroll down the page and only stay above the fold, you would need to make sure that your key messages are clearly visible at the top of the page.
Can a heatmap track visitor behaviour?
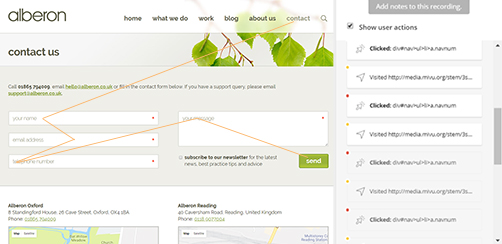
A heat map helps you to identify visitor reactions to your web pages by recording actual behaviour and showing it in a simple, easy-to-read visual format. By seeing the user’s clicks, taps and scrolls, you can identify areas of a page that grab attention and see how users engage with the site.
Cold blue colours represent the least visited areas. Yellow, red and white show the most visited areas.
The heat map can help you to drill deeper into your understanding of visitor behaviour and the parts of your site that do – and don’t – work well. You can track behaviour and map the journey visitors take when they visit your website, including the sessions of those who stay and go on to purchase and which route they take.
Are heatmaps useful for A/B testing?
Heatmaps can also help you to A/B test and pilot different styles and versions of a page before settling on a final version. You can use the heatmaps to see how users interact with the different styles and which is the most effective.
Can heatmaps tell me why I'm losing web visitors?
Heatmaps are also effective in seeing how users interact with your website and help you uncover any issues.
They show where attention drops off and where you lose visitors – highlighting areas of your site that aren’t working and where you could make improvements. This could be by re-ordering text, adding a call to action button or altering forms.
A company who had invested heavily in marketing content once approached us after making no conversions all year. We showed the marketing team how to analyse their web pages to see where visitors were dropping off. Within an hour, we were able to identify the problem. The order page was broken and could not be clicked.
What are the limitations of heatmaps?
A heatmap can show you what has happened, but not why. The problem could be due to a poor colour scheme, content or design, rather than because anything is broken. But it offers a good starting point to carry out further research and testing.
You should also be wary of drawing conclusions based on a limited amount of data from just a few visitors – it might be worth analysing feedback over an extended period of time.
How do I get started?
You can find good heatmapping tools online, such as CrazyEgg, Clicktale, Hotjar and Mouseflow.


